




How is the Katy TX housing market doing right now? The Katy TX housing market covers single-family home sales across Katy and the surrounding west Houston area, including Fulshear and parts of Fort Bend, Harris, and Waller counties. This page tracks the latest numbers every month, so you always have a current answer.
Every month, Jamie McMartin and our team pull the newest local data and talk through what it means for the clients we’re advising. Instead of scattering those insights across many posts, we keep them here in one place. Bookmark this page and check back each month.
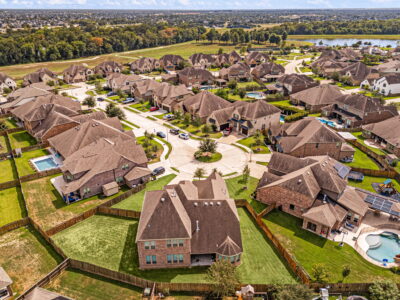
Aerial view of Katy, TX neighborhoods highlighting the local housing market in November 2026.
Quick Answer: What Is the Katy Housing Market Like in November 2026?
As of early November 2026, the Katy TX housing market is cooling into the end of the year. Here’s the short version:
- October home sales fell year over year in the Katy areas we track
- Homes are taking longer to sell, often 70 to 100+ days
- Price reductions are more common than last year
- Median prices are mostly holding, with small dips in some areas
In short, buyers have more time and negotiating room, while well-priced homes still sell.
Katy TX Housing Market Numbers: This Month
Here are the latest single-family figures for the HAR MLS market areas in and around Katy. These figures come from HAR MLS data as compiled by HoustonProperties.com, and every change compares with the same period last year.
|
HAR market area |
Data month | Median price | Avg. days on market | Home sales |
Price reductions |
|---|---|---|---|---|---|
| Katy Southwest | October | $458,500 (−5.0%) | 77 (+8 days) | Down 27% | Up 9% |
| Katy Old Towne | October | $366,990 (+3.4%) | 102 (+12 days) | Down 36% | Up 71% |
| Katy Southeast | September | $410,000 (+5.5%) | 60 (+9 days) | Up 8% | Up 20% |
| Katy North | September | $290,000 (flat) | 72 (+6 days) | Flat | Up 24% |
Katy Southwest and Katy Old Towne already reflect October data. Katy Southeast and Katy North still show September figures, and we’ll update them as new data posts. Because each area includes different home types and price ranges, compare the trends rather than the prices.
How Does Katy Compare With the Wider Houston Market?
Katy is following the broader Houston trend toward a slower, more balanced market. According to the HAR September 2026 Housing Market Update, Greater Houston single-family sales fell 5.7% year over year to 7,030 homes. Inventory rose to a 5.5-month supply, and homes averaged 58 days on market.
HAR also reported a median single-family price of $325,000, essentially flat from a year earlier. Meanwhile, pending sales dropped 11.6%, which points to a quieter end of the year. HAR typically releases its October figures in mid-November, and we’ll add them here once they’re available.
How Are Mortgage Rates Affecting the Katy Market?
Higher mortgage rates are one of the main reasons many buyers slowed down this fall. Freddie Mac’s 30-year fixed average, as published on FRED by the Federal Reserve Bank of St. Louis, reached 7.40% on October 8 and October 15, 2026. By October 29, it had eased slightly to 7.24%.
Even a small drop can help buyers, because it lowers monthly payments. Still, rates remain well above where they stood a year ago. For seller strategies tied to rates, see our post on what Katy sellers can do with mortgage rates above 7%.
What Does the Katy Housing Market Mean for Sellers?
For sellers, this market rewards accurate pricing and strong preparation. Longer days on market and more price reductions show that buyers are comparing carefully. As a result, homes priced right from day one tend to avoid the cycle of cuts later.
Here is what we recommend for Katy sellers right now:
- Price from the newest local sales. Spring and summer comps may overstate today’s market.
- Plan for a longer timeline. Average days on market now run well past two months in several Katy areas.
- Consider buyer-friendly terms. Help with closing costs or a rate buydown may attract payment-focused buyers.
- Prepare before you list. Clean, repaired, well-photographed homes stand out when buyers have choices.
For a full game plan, read the 2027 seller strategies our Katy Realtors recommend.
What Does the Katy Housing Market Mean for Buyers?
For buyers, this is one of the more balanced Katy markets in recent years. More price reductions and longer market times can mean more room to negotiate. In addition, fewer competing buyers during the holidays may reduce pressure.
Buyers should still get pre-approved early and talk with a qualified lender about payment options. You can search homes for sale in the Katy area anytime. Thinking of selling a current home first? We can help coordinate both moves.

Jamie McMartin reviewing Katy real estate market trends and monthly housing data to help clients make informed decisions.
Is the Katy TX Housing Market a Buyer’s or Seller’s Market?
Right now, the Katy TX housing market leans toward buyers, but conditions vary by neighborhood and price point. Houston’s 5.5-month supply sits in balanced territory, and Katy’s slower October sales add to buyer leverage. However, homes in high-demand pockets and well-prepared listings still attract strong interest.
“Monthly numbers tell us the direction, but every home has its own story,” says Jamie McMartin, founder of The Jamie McMartin Group. “We use this data to help our clients make calm, confident decisions, whatever the market is doing.”
For nearby trends, see our Fulshear real estate market update and our look at whether Katy favors buyers or sellers this fall.
Want a Market Update for Your Katy Home?
Monthly market numbers are a great starting point, but your home’s value depends on your street, your upgrades, and your competition. The Jamie McMartin Group can give you a personalized picture of where your home stands in today’s Katy TX housing market.
Start with our Katy home valuation tool to see what your home could be worth today. Then contact The Jamie McMartin Group for a free, no-pressure market review.
Frequently Asked Questions
Are home prices dropping in Katy, TX?
Prices are mostly holding, with small changes that vary by area. As of October 2026, the Katy Southwest median fell 5.0% year over year, while Katy Old Towne rose 3.4%. Your home’s value depends on its location, condition, and competition.
How long does it take to sell a house in Katy right now?
In October 2026, homes averaged 77 days on market in Katy Southwest and 102 days in Katy Old Towne, per HAR MLS data. Well-priced, well-prepared homes often sell faster than average.
Is now a good time to buy a home in Katy?
Many buyers have more choices and more negotiating room than in recent years. However, mortgage rates remain above 7%. Talk with a qualified lender about your budget before you shop.
Will the Katy TX housing market improve in 2027?
No one can predict the market with certainty. Mortgage rates, inventory, and local job growth will all play a role. We track the numbers here every month so you can follow the trend.
How often is this Katy housing market update refreshed?
We update this page monthly, usually after HAR releases new data in mid-month. The “Last updated” line at the top shows the most recent refresh.